
Return to Agilent Operation User Guide
This page is our User Guide for Transmission Imaging with our Agilent Endstation.
1. Load method file
In Resolutions Pro Imaging Method Editor, select your method file from the "Users" folder.
🔑 This is a good place to double check that the IR objective lens and purge shield are correctly in place and the desired magnification is set up (4X, 15X or 25X).
2. Find Centerburst
Press the "Find Centerburst" button.
-
This will check operation of the interferometer and determine the current centerburst position.
-
Note this uses an internal detector and can be performed regardless of sample position in the microscope
3. Focus Sample
Sample position / focus can be controlled using the joystick or the Agilent Wizard Stage Control and Focus Control tabs.
-
Move to the sample you wish to measure. View the sample using "Visible Image" tab in Resolutions Pro.
-
Adjust the Stage Height (z) as needed to bring the sample into appropriate focus.
-
You may need to adjust the sub-stage condenser to get a bright, even illumination.
-
It is common practice to find the focus in reflection and then switch to transmission.
4. Mark sample Region of Interest
If you collected a 4X overview image of the sample,
-
Select the Agilent Wizard "Edit ROI points" tool at the top of the figure.
-
Click on the sample image to add ROI points
The ROI points will appear with estimated IR grid locations.
5. Locate clean background position
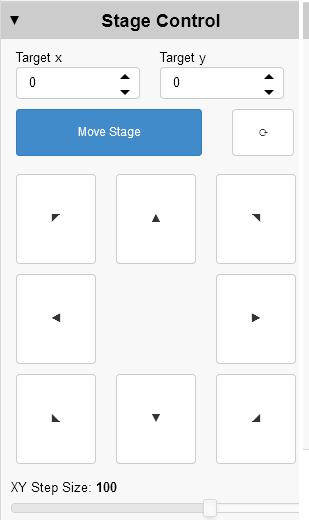
Using the joystick / Stage Control buttons, locate a position on your sample substrate which is clean from particles or contamination.
-
Note that the IR field of view is larger than the visible camera.
-
In Agilent Wizard, press "Set Reference" to store the background position
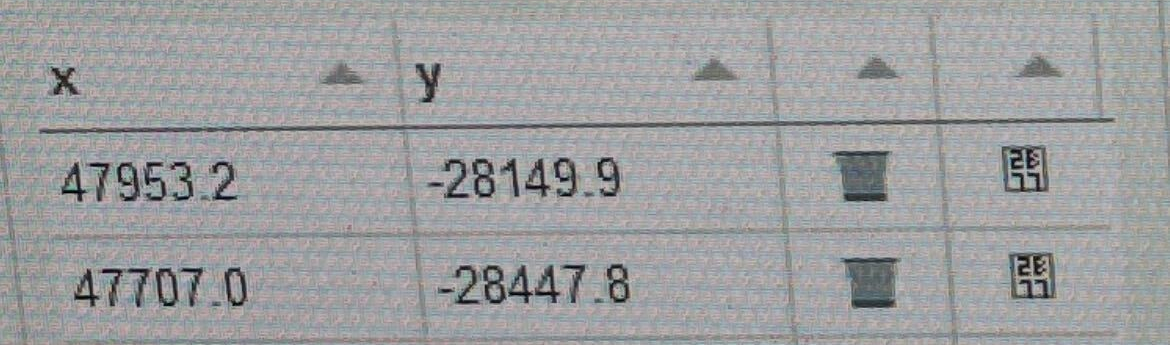
Use the Agilent Wizard to move to the sample. Add a ROI point -> this will be added as the last point in the region. Make use of the "Move-To" feature to move the stage to this point.
Click on a coordinate to edit the ROI point
Click the bin icon to remove a row
Click the numbers icon to move the stage to that position
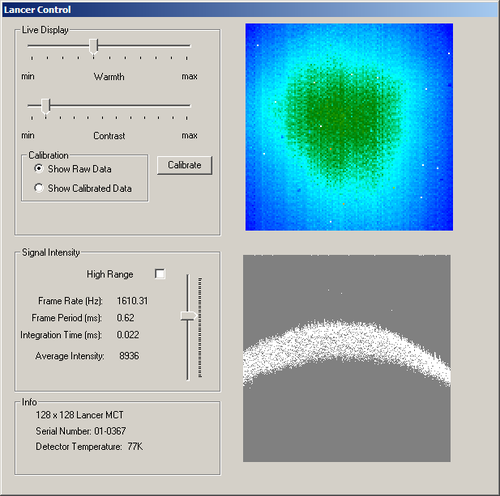
6. Non-Uniformity Correction Calibration
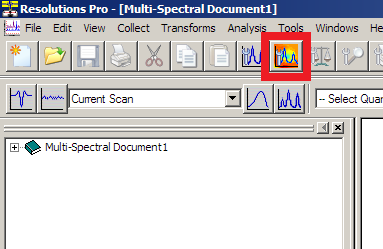
Open Resolutions Pro Imaging Method Editor Live FPA window. Lancer Control will open.
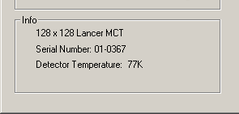
Look at the Info panel and check that the FPA is at the operating temperature:
-
Select
Show Raw Datain theCalibrationbox. -
(On-site) Adjust the sub-stage condenser to increase the signal while maintaining uniform illumination.
-
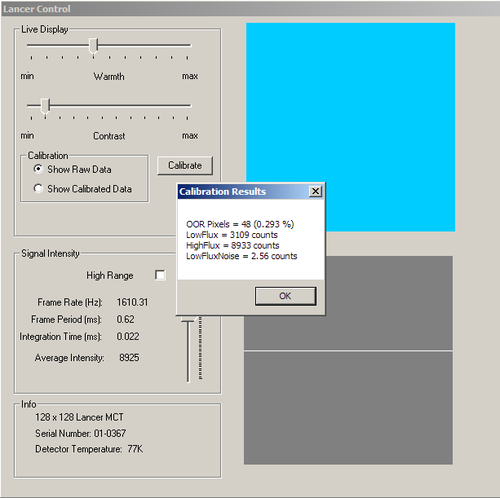
Click
Calibrateto perform the correction. The results of the correction will appear. You may wish to make a note of the integration time and resulting LowFlux/HighFlux values. -
Using Stage Control, move the stage 100 μm ←/→ in X or ↑/↓ in Y and check the live image for deviations which indicate contamination on your reference position.
Adjust the vertical slider bar (controls the integration time) so that the displayed signal is not greater than 70% of the full height and/or the Average Intensity is ~9500. The 70% line is between the "Frame Rate" and "Frame Period" text lines.
If contaminants are observed, you must move to a new spot and recalibrate. Repeat from Step 6. Otherwise, return to the position where the current calibration was measured (Move to Reference) and proceed.
7. Measure background
Click "Background" to start the background / reference measurement. When the "Save as" dialog appears, navigate to the appropriate file location and then enter the unique background file name. For mosaic data collection, create a folder with your sample name and put the background file inside it. You can then use this folder as the mosaic save location and keep the background and sample files together. Give the background a distinct name, i.e. "...date_sample1_scan1_background" or similar.
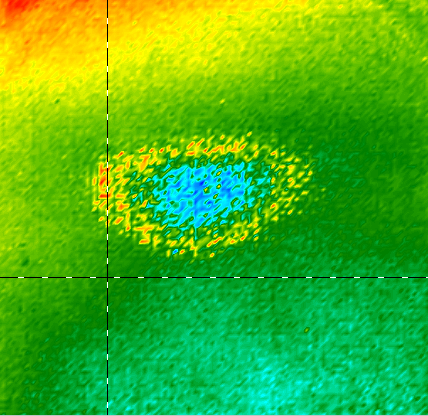
Check the resulting IR image for appropriate signal levels or undesired material.
If you see a circular speckle pattern in the background image, the integration time is too long. You need to lower the integration time slider - you must recalibrate. Go back to Step 6.
If you see evidence of sample or material in the background measurement you must find a new background position. Go back to Step 5.
8. Visible sample image
In the Resolutions Pro Imaging Method Editor "Visible Image” tab:
-
Select "Enable" in the "Visible Mosaic" section
-
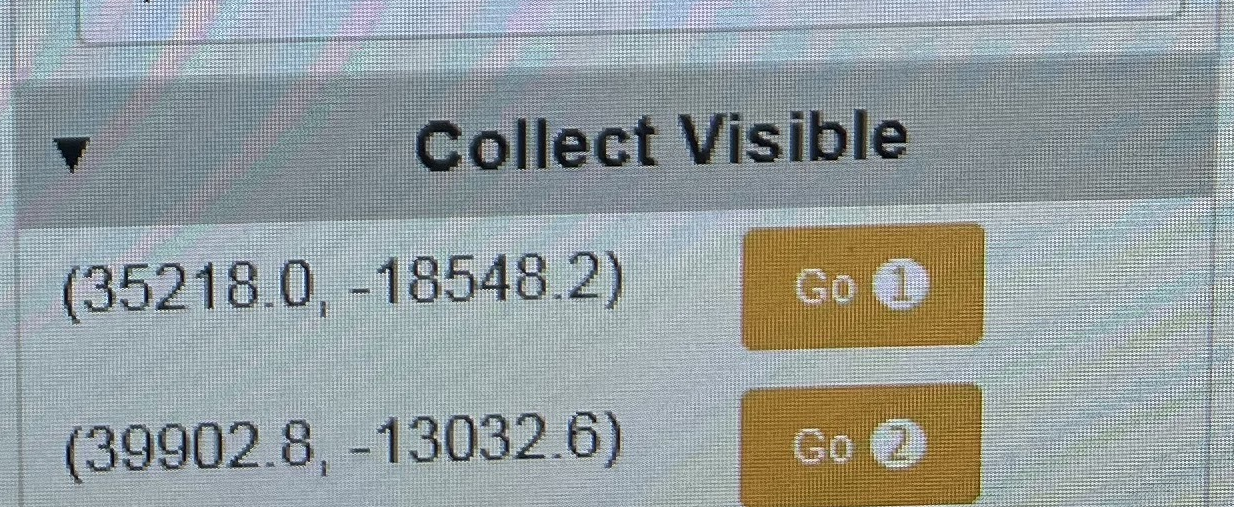
Open the Agilent Wizard Helper Collect Visible tab.
Press the Agilent Wizard Helper "Go ❶" orange button. The stage will move to the first corner of your region.
Press Imaging Method Editor "Set Corner 1" button
Press the Agilent Wizard Helper "Go ❷" orange button. The stage will move to the opposite corner of your region.
Press Imaging Method Editor "Set Corner 2" button -
Click Imaging Method Editor "Capture" to start visible mosaic collection. Open "Captured visible image" tab to monitor.
Visible Image Tip: For multiple tile mosaics the software will save the visible image when the IR sample data is collected. If you are only processing a single tile you must save the collected image to your project folder if you wish to use them. Use the VisMosaicCollectImages shortcut in Windows Explorer and save a copy to the folder with the matching IR data.
9. Define IR measurement area
In the Resolutions Pro Imaging Method Editor "Captured visible image" tab:
-
Click and drag to define the desired measurement area. The locations to be measured will be drawn as red boxes.
-
If the mosaic area is incorrect, select a new area
-
If you wish, you can temporarily store this visible image in the Agilent Wizard with the "+" button next to the "Visible image" list.
Tip: The mosaic area always snaps to the top-left corner of the box drawn
Before you start - make sure you are confident with your sampling area and number of tiles to collect - once you proceed, you must commit to the measurement.
10. Start sample scan
Click the "Scan" button
-
When the next dialog appears, navigate to your Project folder and
-
(single tile) enter a unique file name in the Save as dialog
-
(mosaic) select the folder you created when collecting the background
-
-
Collection begins - you will see a dialogue box pop-up indicating the total number of tiles and measurement progress
Select a separate folder for each mosaic data collection - i.e. if you have to re-collect a scan, create a new folder for the new measurement.
At the end of the data collection, Resolutions Pro calculates the Fourier transform of the raw data. For a large mosaic, this can take 20-30 minutes, during which time the software will not provide any feedback.
Next sample / region
Select your next sample/region in the Agilent Wizard and repeat as necessary.