Return to hATR Microscope Operation User Guide
Using the FPA Detector
This detector needs to only be operated at appropriate temperatures – you must refill the detector with liquid nitrogen at least every 8 hours or risk damaging it. Your beamline staff will show you the liquid nitrogen refill procedure. The FPA detector can never be on when it is warm – if you plan to leave the beamline unattended for a longer duration you must turn off the detector before leaving. When turning off/on the detector, make sure OPUS software is closed. Once the detector is off/on the software can be restarted.
Planning Your Measurements
Raw images will undergo post-collection processing to transform pixel indexes into meaningful sample measurements. The microscope magnification and angle of incidence along with the internal reflective element (IRE) refractive index and geometry and the detector pixel sizes will need to be accounted for in the routine.
Data Collection Workflow
-
Data Collection: Raw images will be collected by the detector in terms of pixel indeces. You can glance at these raw images, but they will contain little spatial information with respect to your sample, and are rotated by the angle of incidence of the microscope. They are also compressed in the optical axis. Images will be planned at specific sample locations by the Wizard application. The image locations are determined by a calculation performed by the Wizard with cropping height, cropping width and effective angle of incidence calculated from user inputs. The software saves the stage location in the file name of each collected image. The software will also save the measurement details such as effective AOI, microscope set angle, cropping width, cropping height.
-
Image Post-Processing:
-
Image correction: rotation, elongation in reflection axis and conversion from pixel index to sample coordinates. The effective angle of incidence, microscope set angle, cropping width and cropping height are used in this stage. Orange scripts will read this information from collected files and input into the image correction algorithms.
-
Image cropping: Pixels are selected from the most in-focus, central region of each image. The crop x/y inputs are used at this stage. This defines the height/width of each ‘tile’ from the respective images.
-
Image stitching: Cropped images are combined to create a large composite image of the sample.
-
Data Collection and OPUS Set-up
HTTP OPUS
A special version of OPUS exists specifically to navigate commands from the hATR Wizard. If you are planning to use the Wizard for measurements, make sure you open the OPUS in the Temp folder on the Bruker computer’s Desktop.
XPM File
The HATR-FPA.xpm file should be loaded into the Advanced Data Collection tab -> if you wish to change the file save location make sure to overwrite the HATR-FPA.xpm file in the HTTP/temp folder. This file will be used by the Wizard to measure. The number of scans and the sample name can be overwritten by the Wizard program, but you might want to adjust these to suit your desired experiment and set defaults.
Troubleshooting OPUS
What to do if OPUS crashes? Shut down the software and try to reopen the OPUS in the Temp folder. If ‘another instance of OPUS is already running’ shows up try to shutdown the computer and restart it with the power button on the computer. Refreshing the start-up may solve the issue. If not, contact your beamline staff!
What to do if you see red error symbols in the FPA Image Acquisition window? Try opening the single file method editor and loading the HATR-FPA.xpm file. Then move back to the FPA Image Measurement and reload the correct .xpm file. If nothing changes, contact your beamline staff – it’s possible the spectrometer and/or OPUS may need to be restarted.
Make sure the last collected background position has the same resolution as your measurement grid settings if the ABS data block is selected in your XPM file.
Wizard Set-up
Regions of Interest
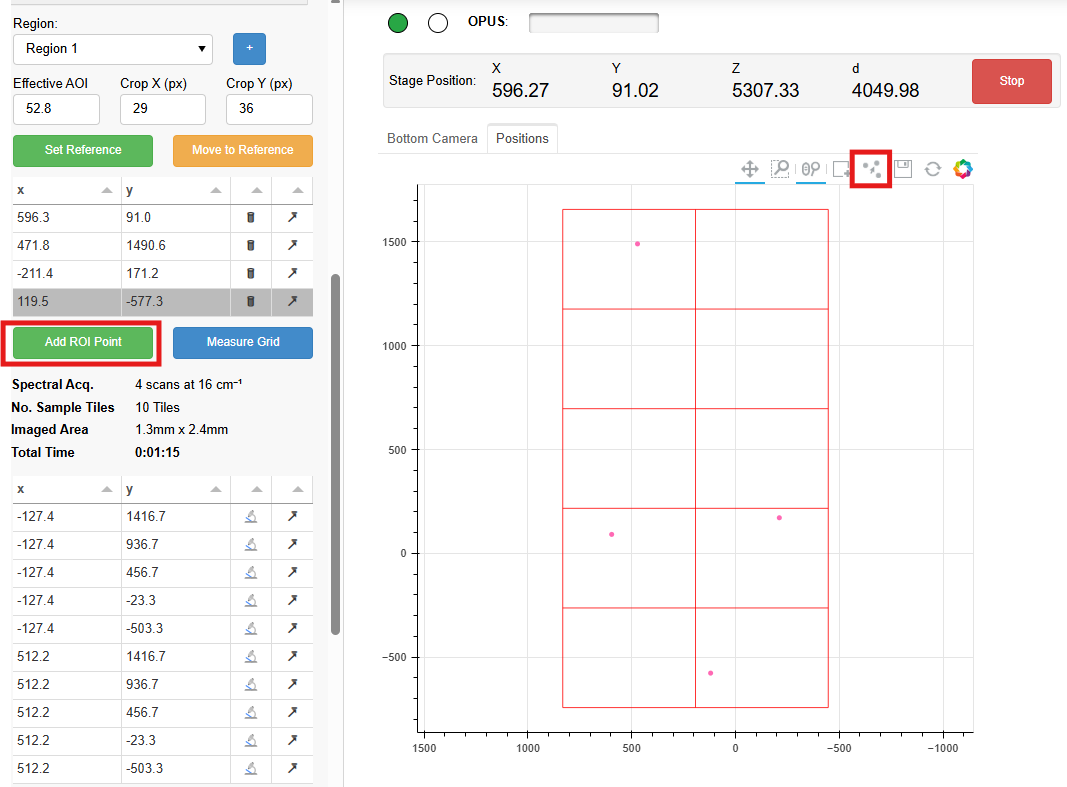
Add measurement points of interest. ‘Add ROI Point’ button will add a point at the current stage positon to the planned region. Navigate around your sample to add further region of interest points. The software will surround all points added in the region of interest with sample tiles from inputted crop x/crop y settings. Points may also be added by clicking on the ROI Bokeh plot.
Determining Pixel Cropping
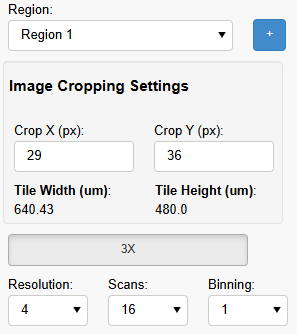
Crop X (px) and Crop Y (px) are set in the hATR Wizard software. Adjust the pixel cropping to compromise between measurement time and image quality. Starting values should be set to the Wizard’s default parameters and can be changed by the user. Use the Wizard/image area as a guide for how long the measurement will likely take and the expected image area. Adjusting these values will adjust the width and height of each FPA measurement/tile.
Time Estimator
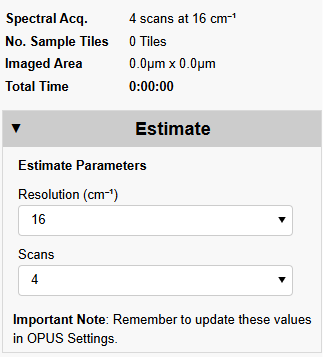
Just underneath the planned measurement locations there is an ‘Estimate’ Accordian where you can see the estimated timing for the current ROI plan with the selected Resolution and Scans set in the drop-down menu. Once you have decided these paramters, remember to update the OPUS Settings to reflect these changes.
Wizard OPUS Settings
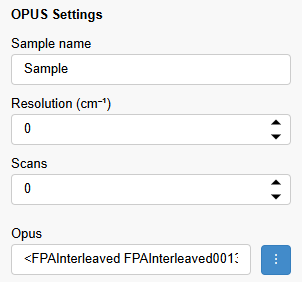
Scrolling down to the bottom of the left pane panel, you will see inputs underneath the ‘OPUS Settings’ title. Update the Sample name, Resolution, and number of Scans to reflect your desired experiment. These will be used by the software to overwrite the default OPUS settings.
Saving and Restoring Wizard Session
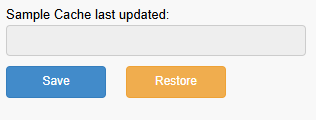
At the very bottom of the panel, you will see the Save/Restore buttons:
Save → Saves the current Wizard session to the Cache.
Restore → Upon reloading/opening the hATR wizard program, hit the ‘Restore’ button to restore the last saved session.
Planning Measurement Positions
Add ROI Points
-
Add ROI Point Button: This green button (outlined in red in the above image) allows the user to Add a new ROI point to the measurement plan. It will append the current stage location as an ROI point.
-
Edit ROI Points Button on Bokeh Plot: The three dots surrounding an arrow button is located above the Bokeh plot ‘Positions’ Tab. This Bokeh plot provides a visual showing the ROI points (red) and the measurement locations planned by the software (red box outlines). The software takes your ROI points and surrounds them with measurement ‘tiles’ in a grid formation - taking into account your set pixel cropping settings and the effective angle of incidence set above. In the example, the software is planning a 10-tile measurement plan (2-tiles in X and 5 tiles in Y). Each box represents one measurement location, one file to be collected by OPUS.
Add New Region
Use the blue ➕ button to add a new region → this will append the new region to the selection drop-down menu and you will have a fresh view on your Bokeh plot. This can help with measurement planning when multiple measurement regions are desired for the same sample.
Measure Grid
The blue button, ‘Measure Grid’ will start the OPUS acquisition, moving the stage to each of the XY locations in the planned array and acquiring an FPA image at each location.
Typical workflows
-
One background, multiple sample measurements at different locations. Perhaps your background is of the bare crystal and the sample on top of the crystal at different locations. It is recommended that you stay close to the center X position for these (+/-1250um in X is reasonable). In this case, the background can be collected first at the background location. Once the sample is in place you can collect a grid/series of measurements of your sample.
-
A background measurement and sample measurement at each measurement location. Perhaps you measure a grid with the bare crystal and obtain a matrix of data. Then with the sample in place you measure the same exact area again. In this case, the absorbance data will have to be calculated after data collection. This type of dataset could also be used to compare two measurement conditions to eachother i.e. a battery before/after discharging/charging. The same locations on the crystal with different temperature conditions applied to them, you name it!
Save Stage Positions
This feature allows one to save XYZ stage locations into the Wizard. In some cases, fine-focusing may be required for your sample and you may want to reference the XYZ position for later use. If you find a focal point you want to reference later this would be a good place to save the point. As of now, there is no naming system – this would be a nice update to this feature. Save stage positions allow for measurement planning, crystal orientation
Quick Set-up
-
Input IRE and microscope information into the hATR Wizard
-
Adjust Crop X and Crop Y if desired
-
Add ROI points to define image area of sample
-
Change the name of new regions of interest for easier data processing and sorting
-
Measure Grid
-
Process Data in Quasar
OPUS Data Blocks
ABS – absorbance of the sample measurement (-log[SSC/RSC]) – it’s only beneficial to save absorbance data if you only intend to have one background position collected at the beginning of the dataset.
SSC – single channel of the sample measurement – it’s best to always save this data in case you need to reprocess afterwards
RSC – single channel of the reference measurement
Tip: If you are saving absorbance (ABS) data blocks you must collect a background measurement in OPUS before commanding the Wizard to measure an area.
Tip: Collect a background measurement at the achieved focus position. Then deposit a water droplet onto the FAC surface and collect a small grid to see where the water is and to resolve the droplet boundary conditions. This provides a guide in selecting an appropriate cropping settings.
Tip: If you are planning to save the Absorbance data block you must make sure the background measurement was obtained with the same resolution as you set for your sample grid.
Tip: At regular checkpoints during your experiment, remember to hit ‘Save’ so you can re-load your session if the program crashes/closes for some reason.
Tip: Make sure your OPUS XPM file and Wizard OPUS Settings are set before committing to the measurement. Contact your beamline staff if you run into an issue with this.