This page outlines some small tips and tricks that make working with your data in Quasar even more fun and rewarding!
If you're struggling with something annoying or overly tedious, please let us know.
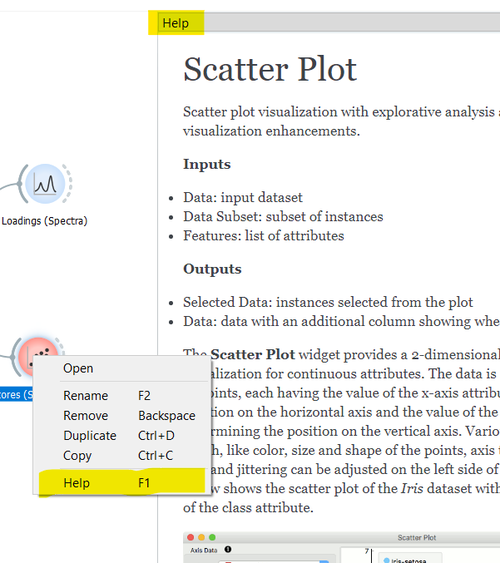
Widget Help
Each widget has help documentation!
Access it:
-
Right click on widget, select help
Information in Help:
-
Types of inputs (data, widgets, etc)
-
Types of outputs
-
Purpose of the widget
-
How to use the widget
-
Widget options
-
References
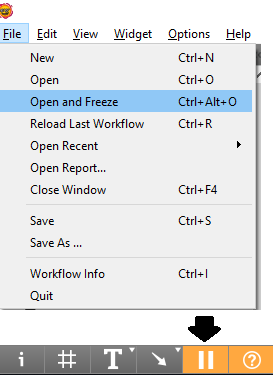
Open and Freeze
-
If you want to look at something in your workflow, but don't want to load the dataset or trigger any data processing load it with the "open and freeze" option located under the file menu! Once you have everything sorted you can click the pause button in the bottom left hand corner and processes will proceed as expected.
-
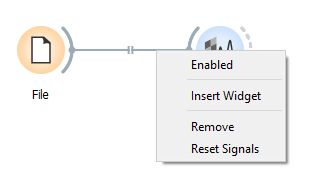
If you have a large workflow and want to stop some parts from updating, you can disable a signal connection by right-clicking on it and deselecting "Enabled".
-
Data file locations are saved relative to the workflow file, so keeping your data and workflows together makes sharing analysis easier!
Data analysis not working as expected?
-
One of the first things to check is the wire connections between widgets
-
Double click on wire
-
Pop-up with connection options opens
-
Draw connection
-
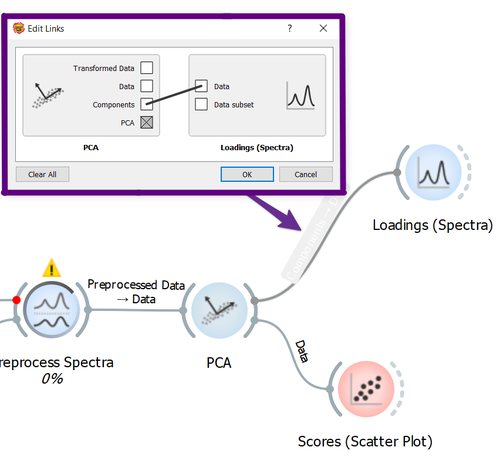
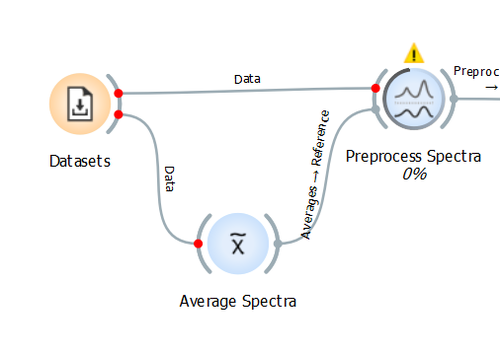
Red dots at Widget Connections
... what does it mean?
-
Data is still being loaded from the File or Datasets widgets
OR
-
Data is being processed in a widget and isn't ready to be passed to the next connected widget
When the red dots disappear it's go time - the data has been passed to the widget!
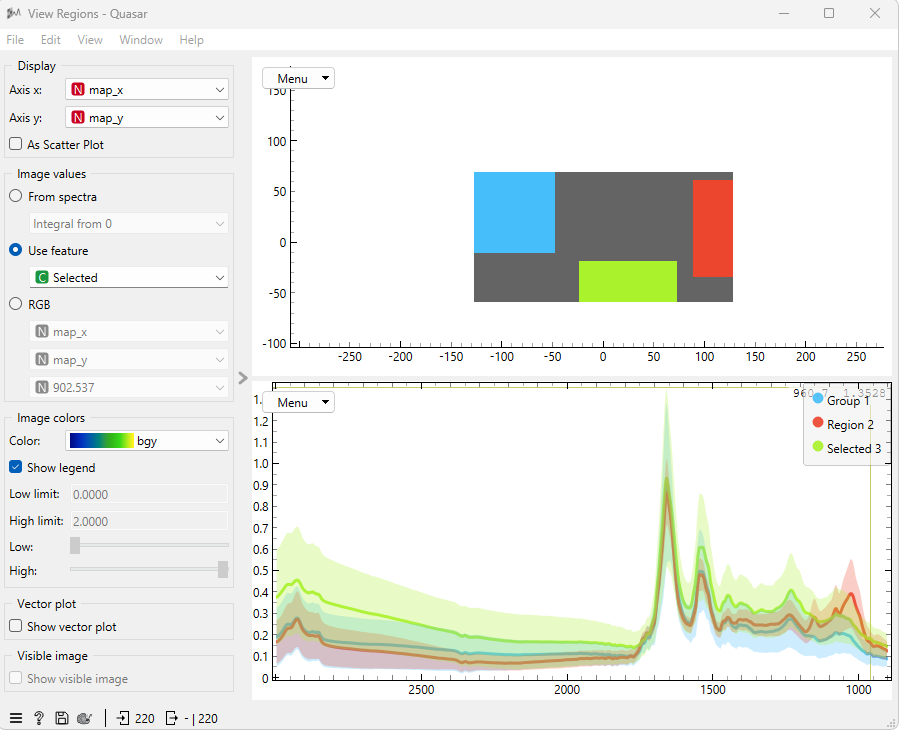
Hyperspectra
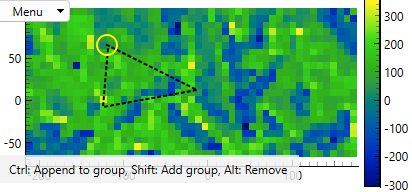
One of the powerful features of the Hyperspectra widget is custom region selection.
-
When selecting a region, you can use a simple rectangle or a custom polygon.
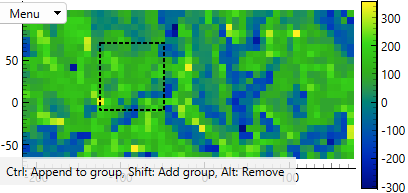
Keyboard Shorcuts
Hold CTRL to Append to group
Hold SHIFT to Add group
Hold ALT to Remove selected points
Careful: Removing regions is done all-or-nothing by clicking on the white boundary area of the figure. This can also happen accidentally as clicking a pixel without holding buttons will discard the previously selected points/regions.
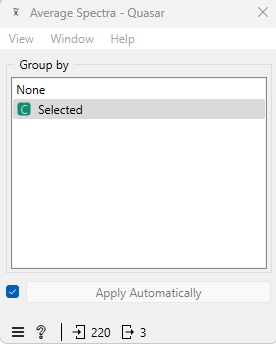
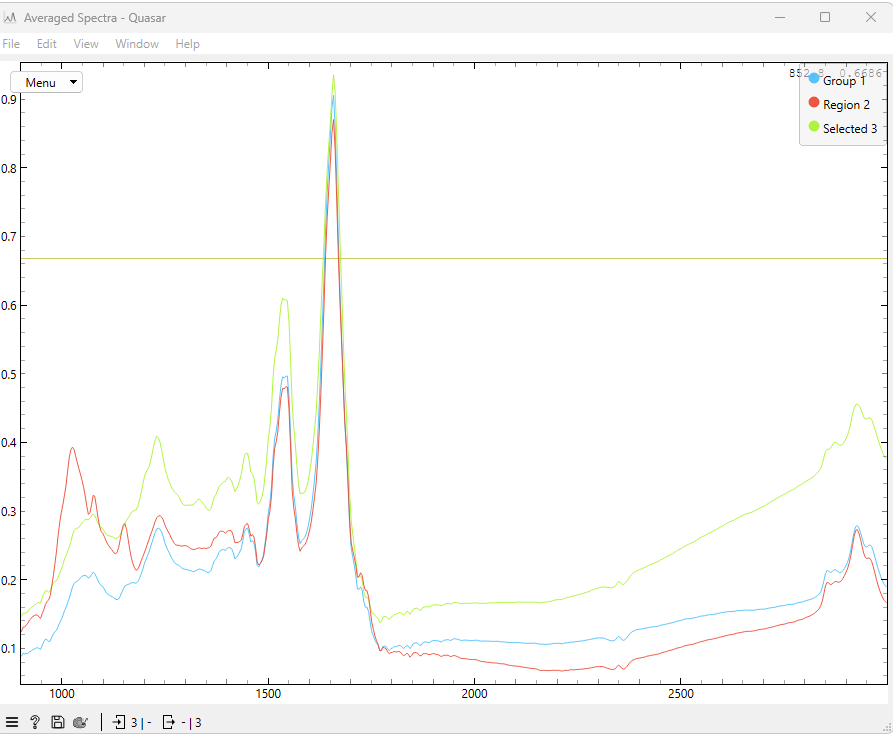
-
In the case of multiple region selection, you must use the "Data" output (as opposed to the Selection output) to see the annotated spectra.
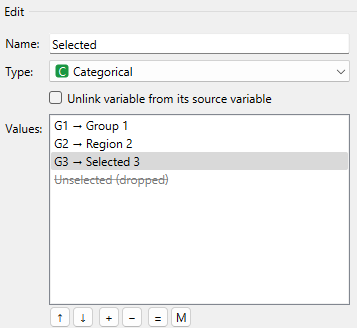
-
One can use the ‘Edit Domain’ widget to rename the selected regions: