You may already have some custom algorithms implemented in Python which have not (yet!) been integrated as a widget in Quasar / Orange. This section will give an introduction to the Python Script widget and some details when integrating with spectral data in Quasar.
This page assumes familiarity with the Scientific Python ecosystem and with Python programming.
Python Script widget
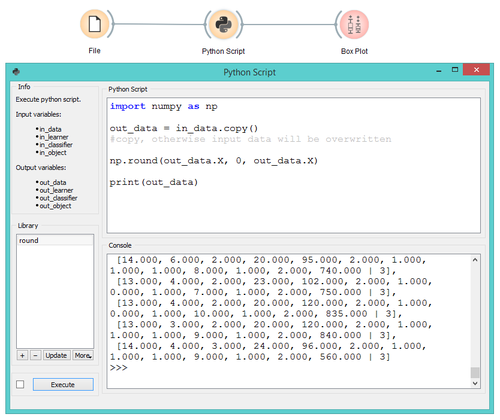
The Python Script widget provides programmatic access to your data in the middle of a workflow. This can be either pre-scripted (Python Script pane) or interactive (IPython Console pane). Scripts can be saved as stand-alone *.py files and loaded into new workflows or shared with your colleagues.
An excellent introduction to this widget for general use in Orange can be found in the Orange widget catalog: Orange Data Mining - Widget Catalog
Orange Scripting
A full introduction to scripting Orange is beyond the scope of this page. The following resources can get you started:
In particular, the Data model and Data Table pages will help orient you to the Orange.data.Table data structure.
Quasar Spectral Data
If you are used to working with spectral data in NumPy or pandas data structures in Python, you may want to skip learning the Orange Table data structure and quickly get your data in a familiar object. The following sections will point you how to access the data and navigate some of the special structure in Quasar.
Energy Axis
The energy axis (wavenumbers, eV, etc) is stored as column headers (mydata.domain.attributes). To build a 1D array of energies from a spectroscopy Table, use the built-in getx() function on your table:
energy = orangecontrib.spectroscopy.data.getx(mydata)
Note that if any attributes cannot be converted to float, the function will simply return an array of indices.
Spectral Data
The spectral data itself is stored in a 2D numpy array accessible at mydata.X.
Spectra are stored row-wise, and normal numpy slicing can be used:
mydata.X[2]would return the spectrum in the 3rd row of the table.
Hyperspectral Cube
To reshape the hyperspectral data from a flatten 2D representation in the spectroscopy Table to a cube array, you need to provide the meta attributes where the x and y coordinate axes are stored. For most hyperspectral datasets, these are labelled map_x and map_y. This example results in the hypercube accessible as hypercube and the energy, x and y axes as energy, map_x, and map_y, respectively.
import numpy as np
from orangecontrib.spectroscopy.data import getx
from orangecontrib.spectroscopy.utils import get_hypercube

mydata = in_data.copy()

energy = getx(mydata)
x_attr = mydata.domain["map_x"]
y_attr = mydata.domain["map_y"]
hypercube, lsx, lsy = get_hypercube(mydata, x_attr, y_attr)
map_x = np.linspace(*lsx)
map_y = np.linspace(*lsy)
Output your result
Existing data Table:
If you have just in-place modified your (copied) data, you can simply output the modified table directly:
out_data = mydata
Remember not to in-place modify the original in_data object, always use mydata = in_data.copy() first.
Create new data Table:
If you have a new data set with no connection to the previous, you can create a new Table. This will break any Domain / Instances connection to the input data.
out_data = orangecontrib.spectroscopy.data.build_spec_table(features, data, additional_table=None)
where
featuresis a 1D numpy array defining the energy axis (wavenumbers, eV, etc) (size m)datais a 2D numpy array (shape (n, m)) with values- (optional)
additional_tableis an Orange.data.Table with only meta or class attributes (size n)
pandas DataFrame
Orange has built-in helpers for converting to/from Orange.data.Table and pandas.DataFrame data structures. This may be useful if you are already comfortable working with pandas.
df = Orange.data.pandas_compat.table_to_frame(in_data)table = Orange.data.pandas_compat.table_from_frame(df)
Note this is not perfectly lossless: in particular, metadata axes important for hyperspectral data may be lost.